

- Documentation
- Getting Started
- VBDepend Analysis
- Code Rule and Query
- VBDepend Features
- Build Process Integration
- Code Metrics Definitions
- Trend Monitoring
VBDepend Analysis
- Introduction
- Warnings about the health of the build process
- Running an Analysis with VBDepend.Console.exe
- Analysis Option
Introduction
VBDepend gathers data from a code base. This includes quality code metrics, componentization/architecture/dependencies, evolution and changes, state mutability, usage of tier code and more. The amount of data gathered is proportional to the size of the code base and can become pretty big in case of a large application analyzed. VBDepend added value lies in its capabilities to let the user browse readily this huge amount of data. This way developers and architects can know precisely what’s really happening inside their shop and can take decisions based on real facts, not based on intuition and rumor. There are 2 distinct scenarios to browse data:
- Through a report: VBDepend analysis process can be integrated into a build process and can produce a customizable HTML report each time the analysis is run.
The is suited to produce daily dash-boards useful for every members of the team, even non-technical ones.
- Through the interactive UI: The interactive UI comes with several panels to visualize and query interactively information about the code base. Interactive UI users are architects and developers that need to dig into details of the code base at any time during development time.
▲▲ Go to Top ▲▲
Warnings about the health of the build process
These warnings can be found:
- in XML format in the file $AnalysisResultDir$\InfoWarnings.xml,
- in the report section VBDepend information and warnings,
- in the panel VBDepend Error List in the interactive UI.
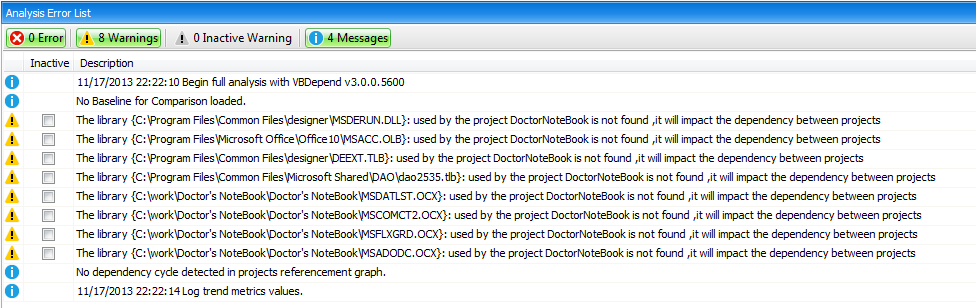
What we mean by the health of the build process is some details that can reveal potential flaws. Concretely this includes:
- Parsing errors.
- External referenced libraries not found.
▲▲ Go to Top ▲▲
Running an Analysis with VBDepend.Console.exe
VBDepend comes with 2 executables:
- VBDepend.Console.exe to run an analysis.
- VisualVBDepend.exe a standalone executable to run interactive UI.
VBDepend.Console.exe is a classic console executable that takes command line arguments. The only required input is an absolute path to the VBDepend project file (extension .cdproj) that defines the code base to be analyzed. Several command line arguments can be provided and they are listed here: VBDepend.Console.exe. Basically these arguments will let you override the output folder where data produced by the analysis will be persisted and provide a XSL sheet to customize the report. A simple exec command is needed to integrate VBDepend.Console.exe into your build process. More documentation is available concerning the integration of VBDepend with different build technologies:
▲▲ Go to Top ▲▲
Analysis Options
To handle real-world scenarios, there are several analysis options. Options can be tuned through the VisualVBDepend > Project Properties panel. Options are then persisted into the VBDepend project file (extension .bdproj) and can be harnessed at analysis time.
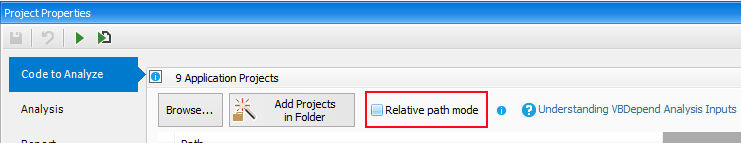
The first option is the ability to choose between absolute and relative paths to folders where analyzed projects are stored. If you choose the option value relative path, paths are relative to the folder where the VBDepend project is stored. This option is useful when the VBDepend analysis is performed on several machines (build servers, developer machines…) where the root folder of the whole development shop can vary.
In the VisualVBDepend > Project Properties > Analysis sub-panel, you’ll find 2 interesting options beside the project name and output folder.
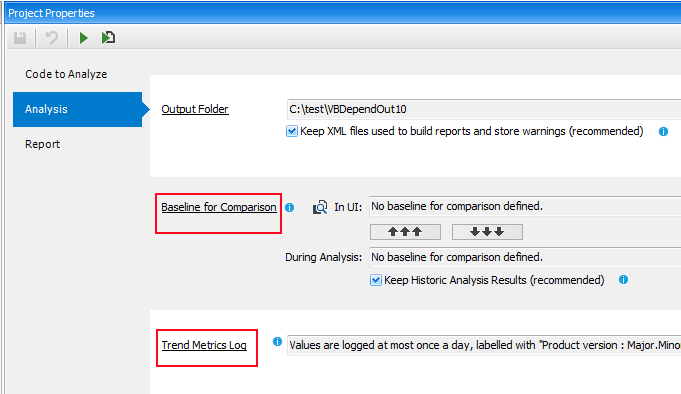
The Baseline for Comparison option lets define the previous analysis result on which to compare the current analysis performed (or the current analysis result loaded in interactive UI). This is useful if you’ve defined some CQLinq rules about evolution of your code base like for example, get all new or refactored methods (More information about this can be found here: Reporting Code Diff) :
warnif count > 0Basically, here (m.WasAdded() || m.CodeWasChanged()) means was added or refactored compare to the baseline. The baseline for comparison can be
from m in Application.Methods where
(m.WasAdded() || m.CodeWasChanged())
select new { m, m.PercentageCoverage }
- a particular result (like the analysis of the last release we’ve made),
- a result made N days ago
- or the last analysis result available.
The Trend Metrics Log option lets specify the frequency of logs, like at most once a day or a week
▲▲ Go to Top ▲▲